
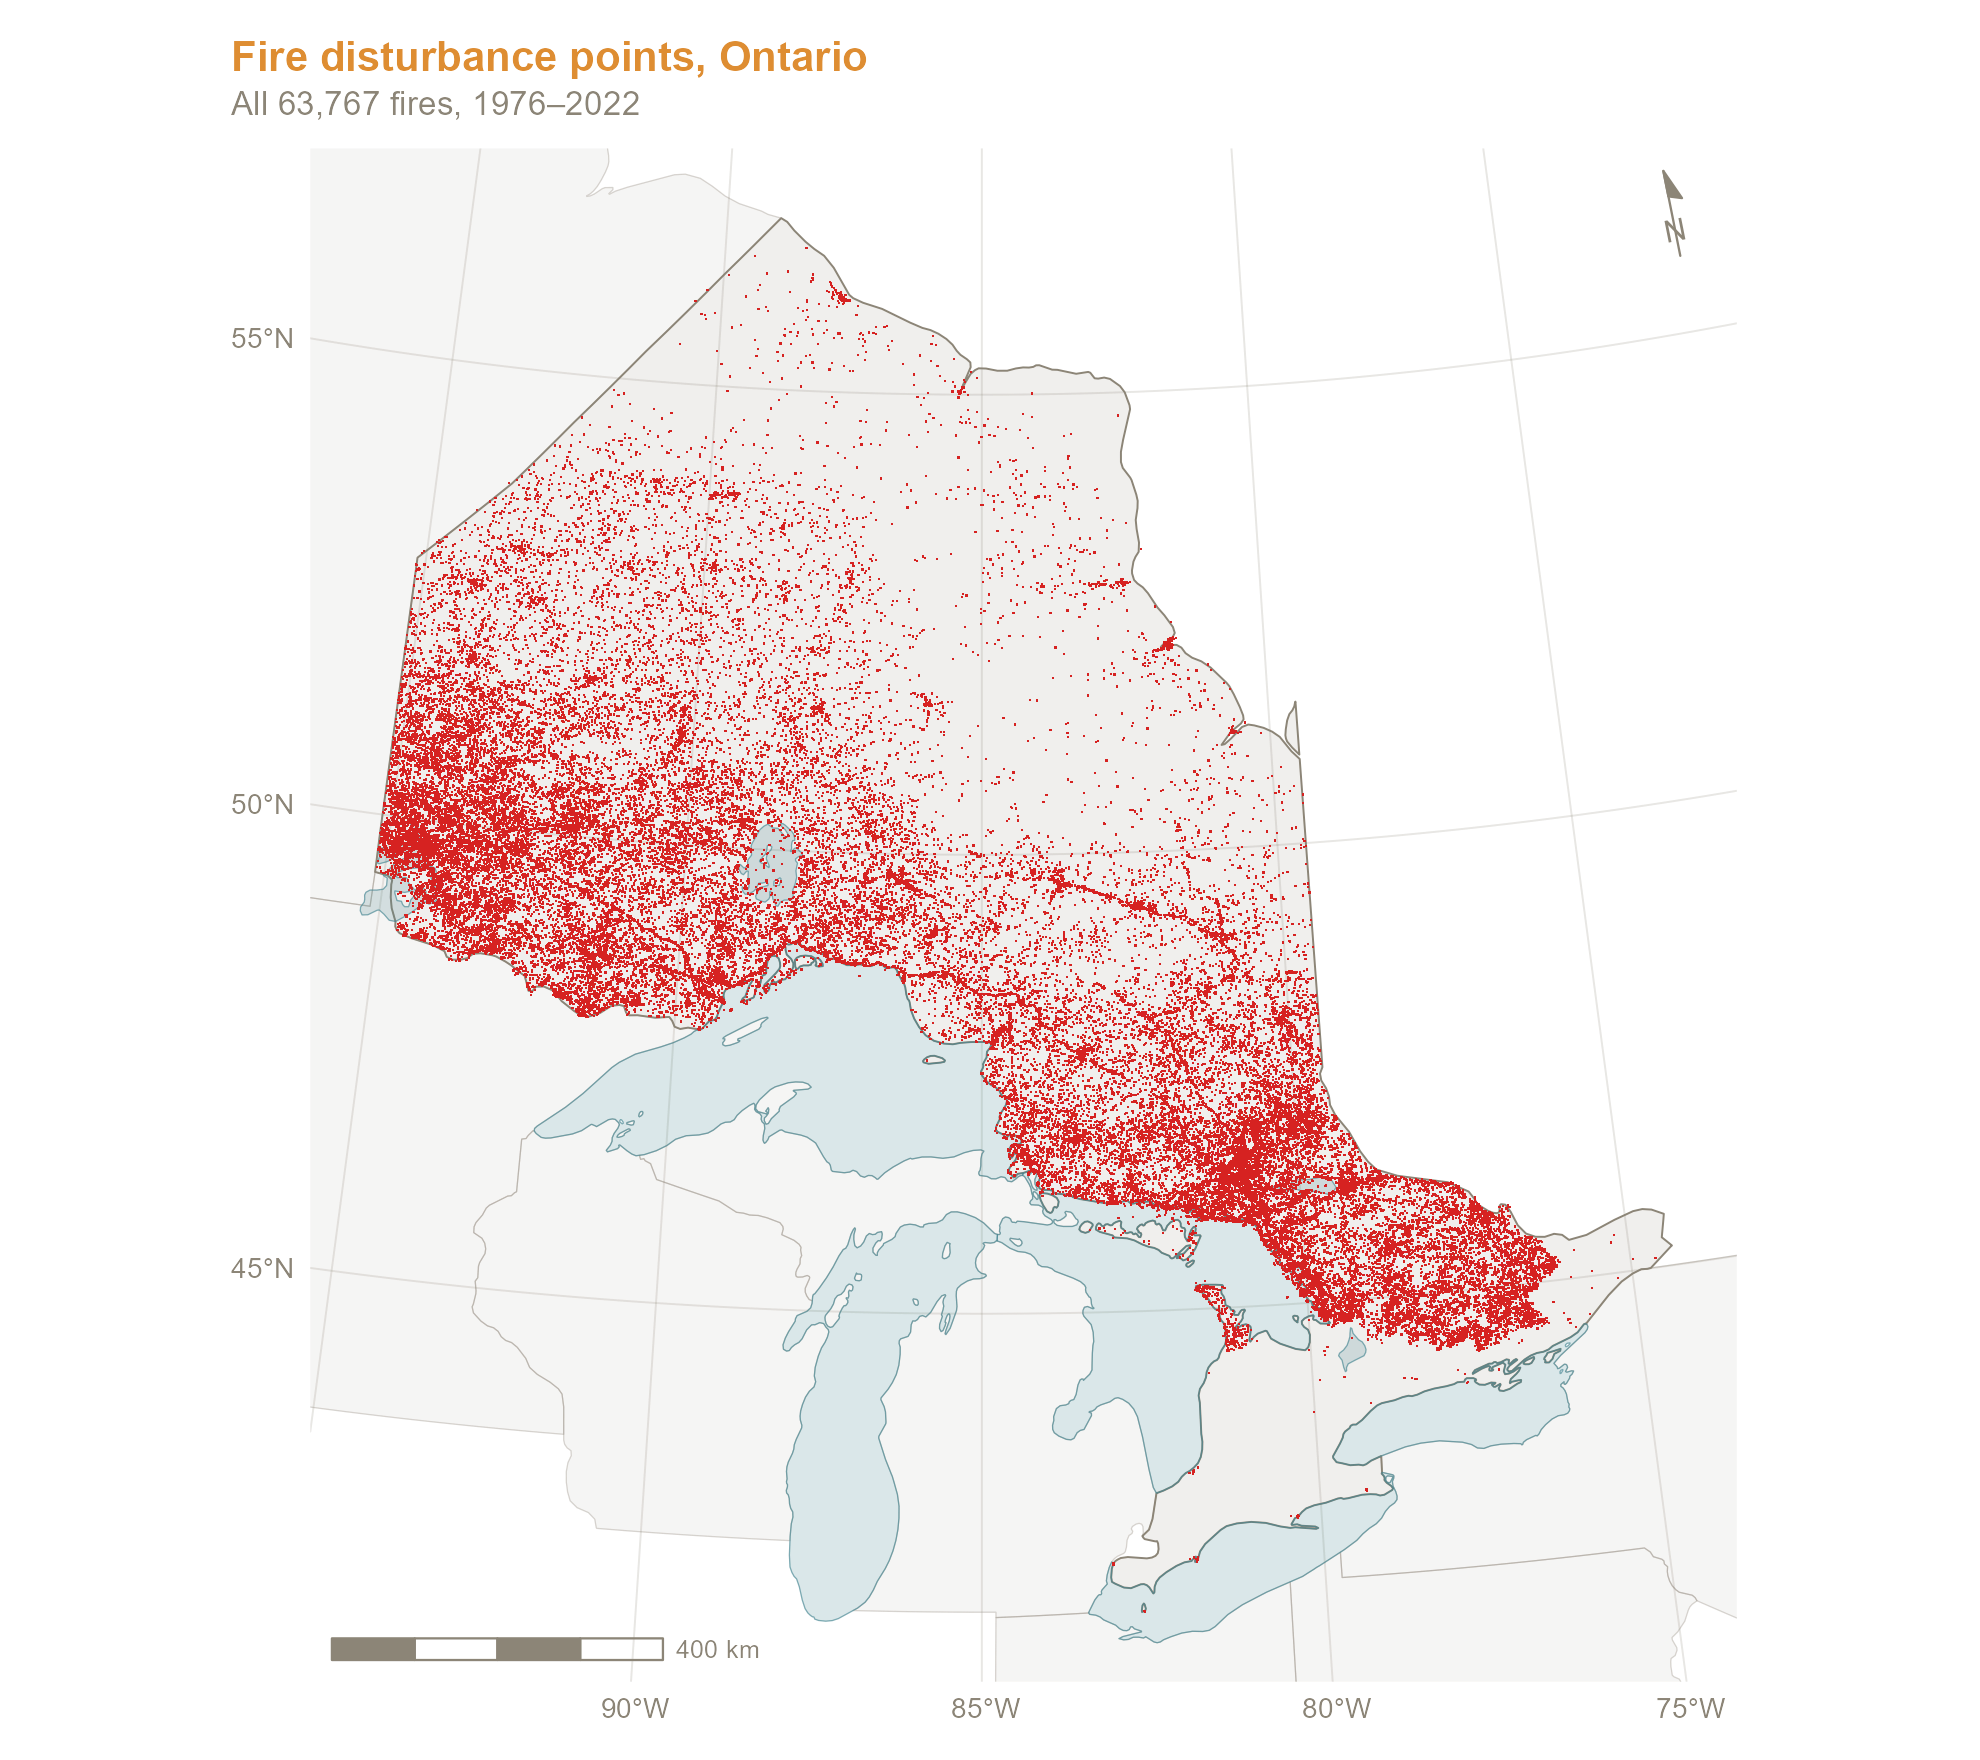
An analysis of Ontario’s Fire Disturbance Point data from the Ministry of Natural Resources and Forestry: 63,767 fires from 1976 to 2022, each with a location, year, cause and final size. Built in R.
View the full interactive report → · Code on GitHub
What it covers
- Fire size: how skewed final sizes are (most fires are tiny, a few burn tens of thousands of hectares)
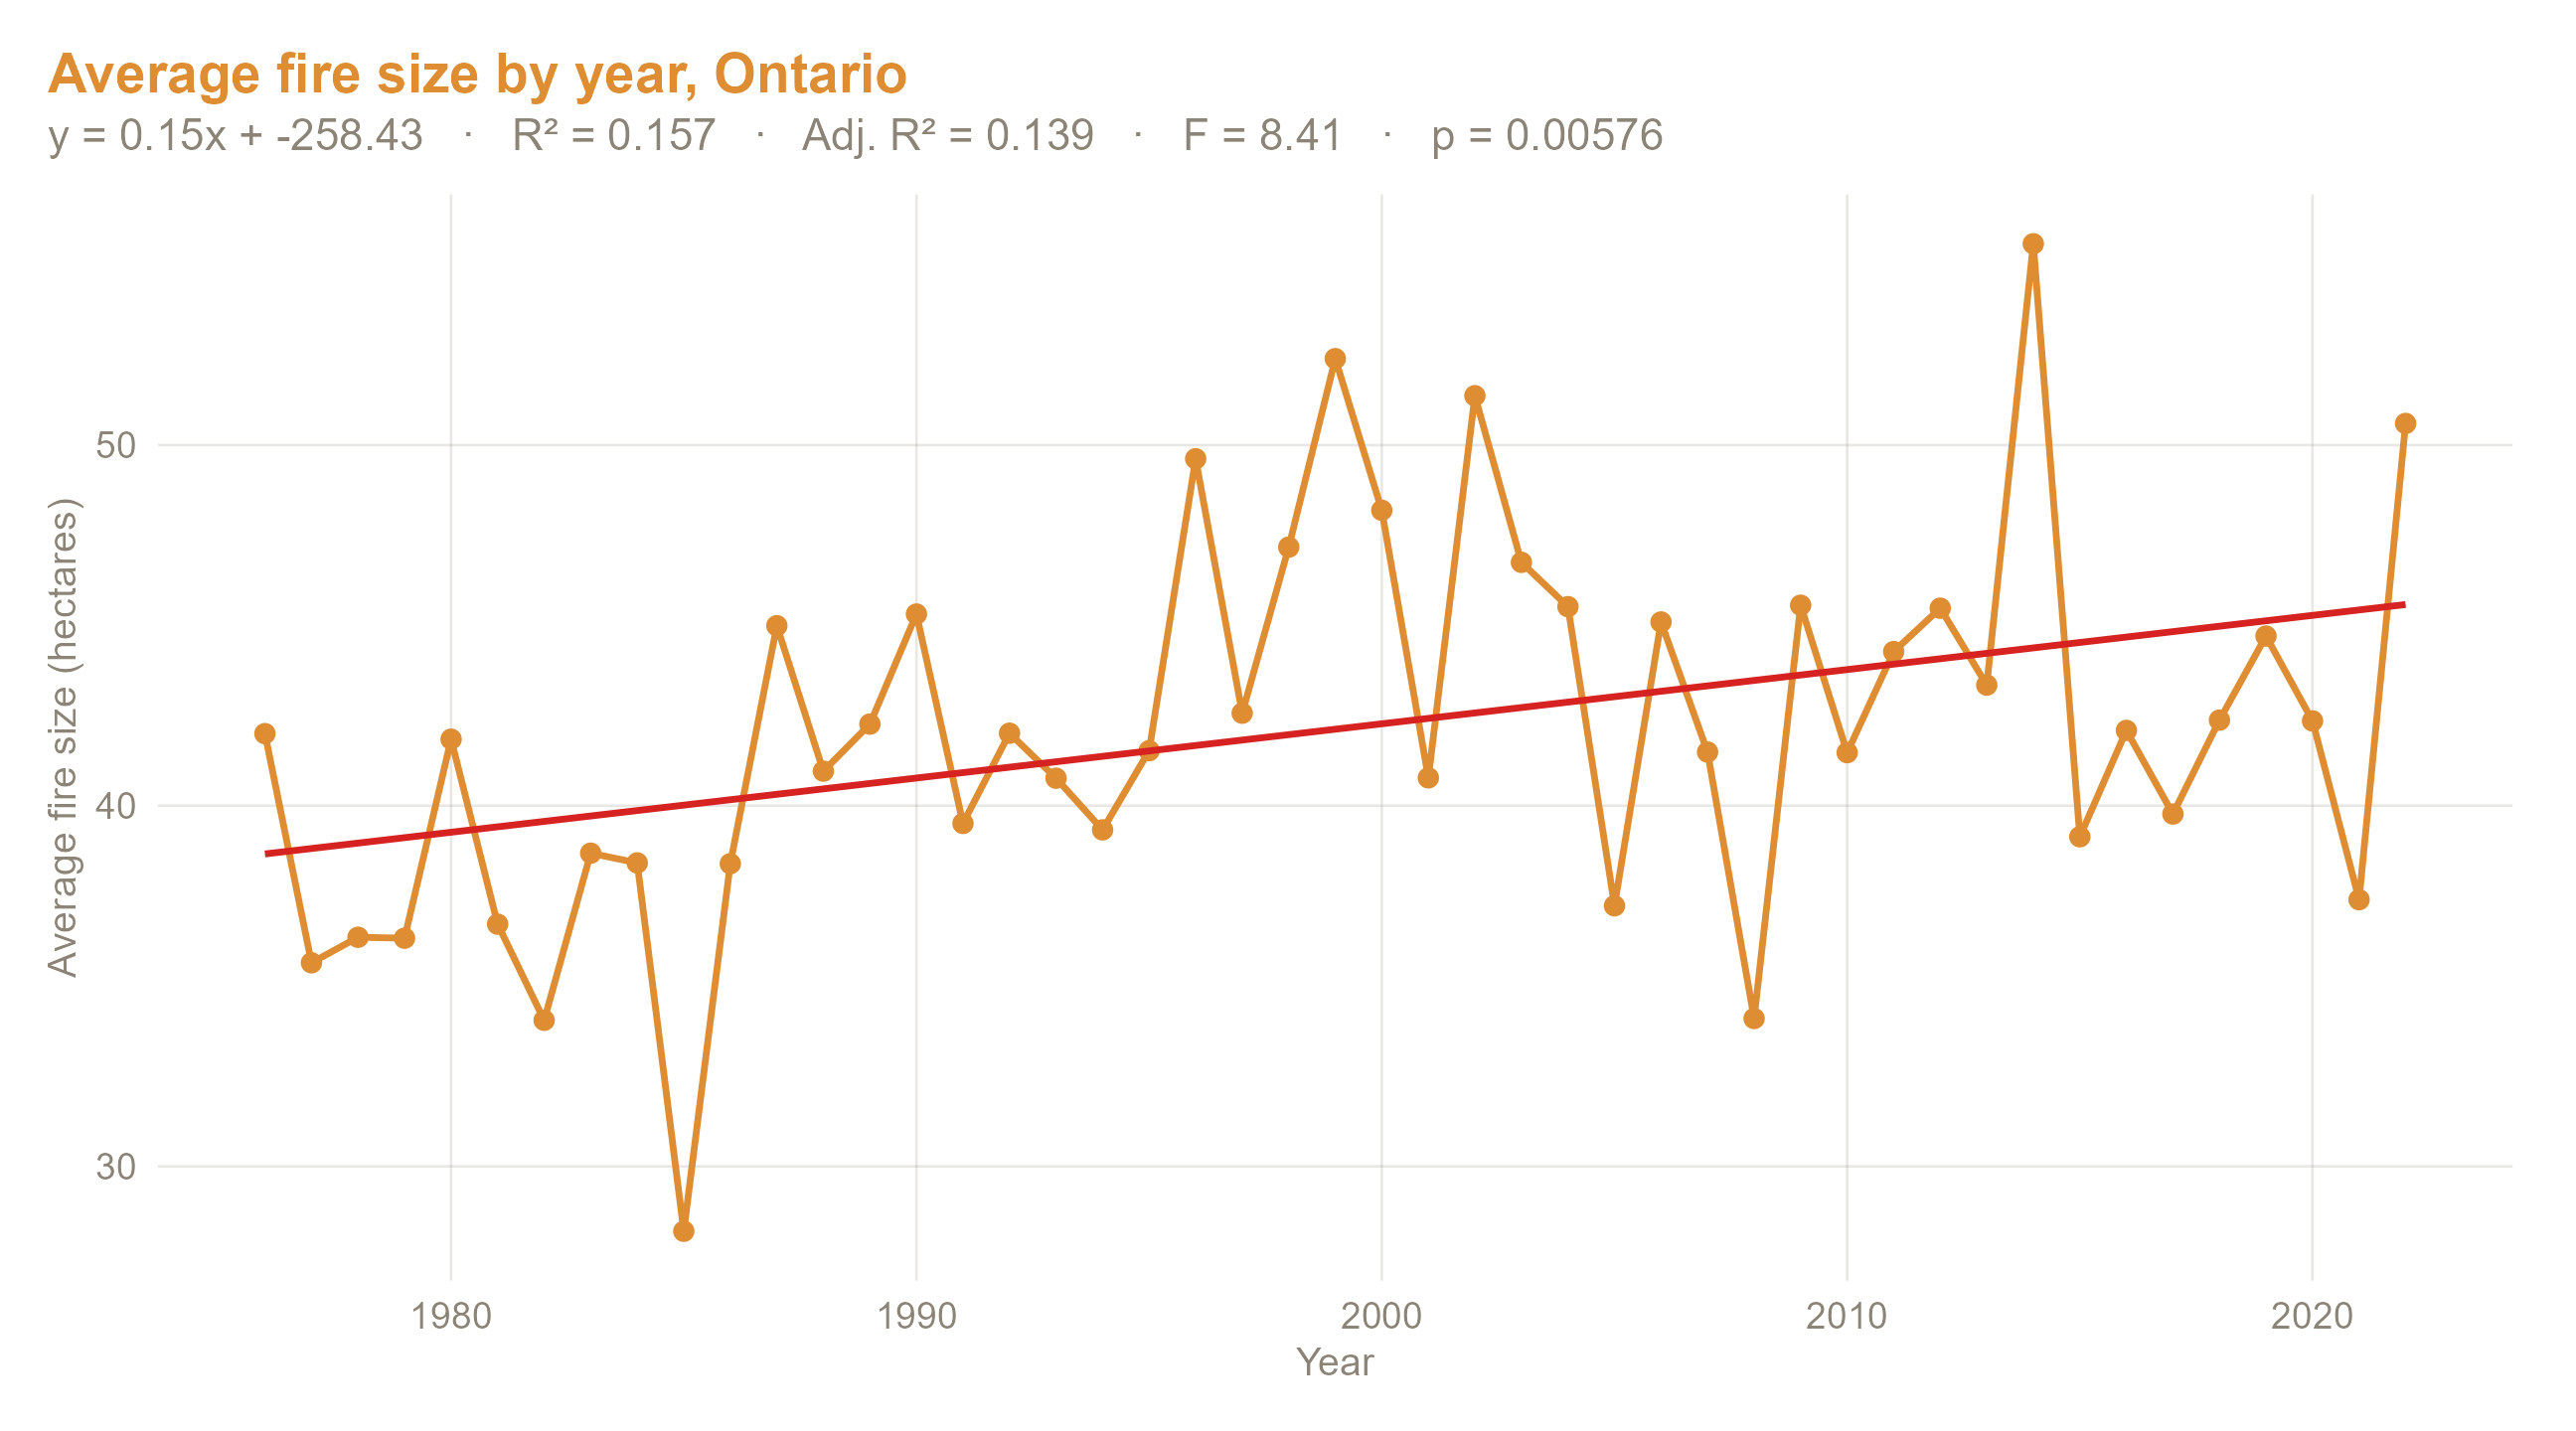
- Trends over time: median and average fire size by year, with a linear regression, and fire frequency by year
- Where fires happen: every fire mapped in Ontario’s own Lambert projection
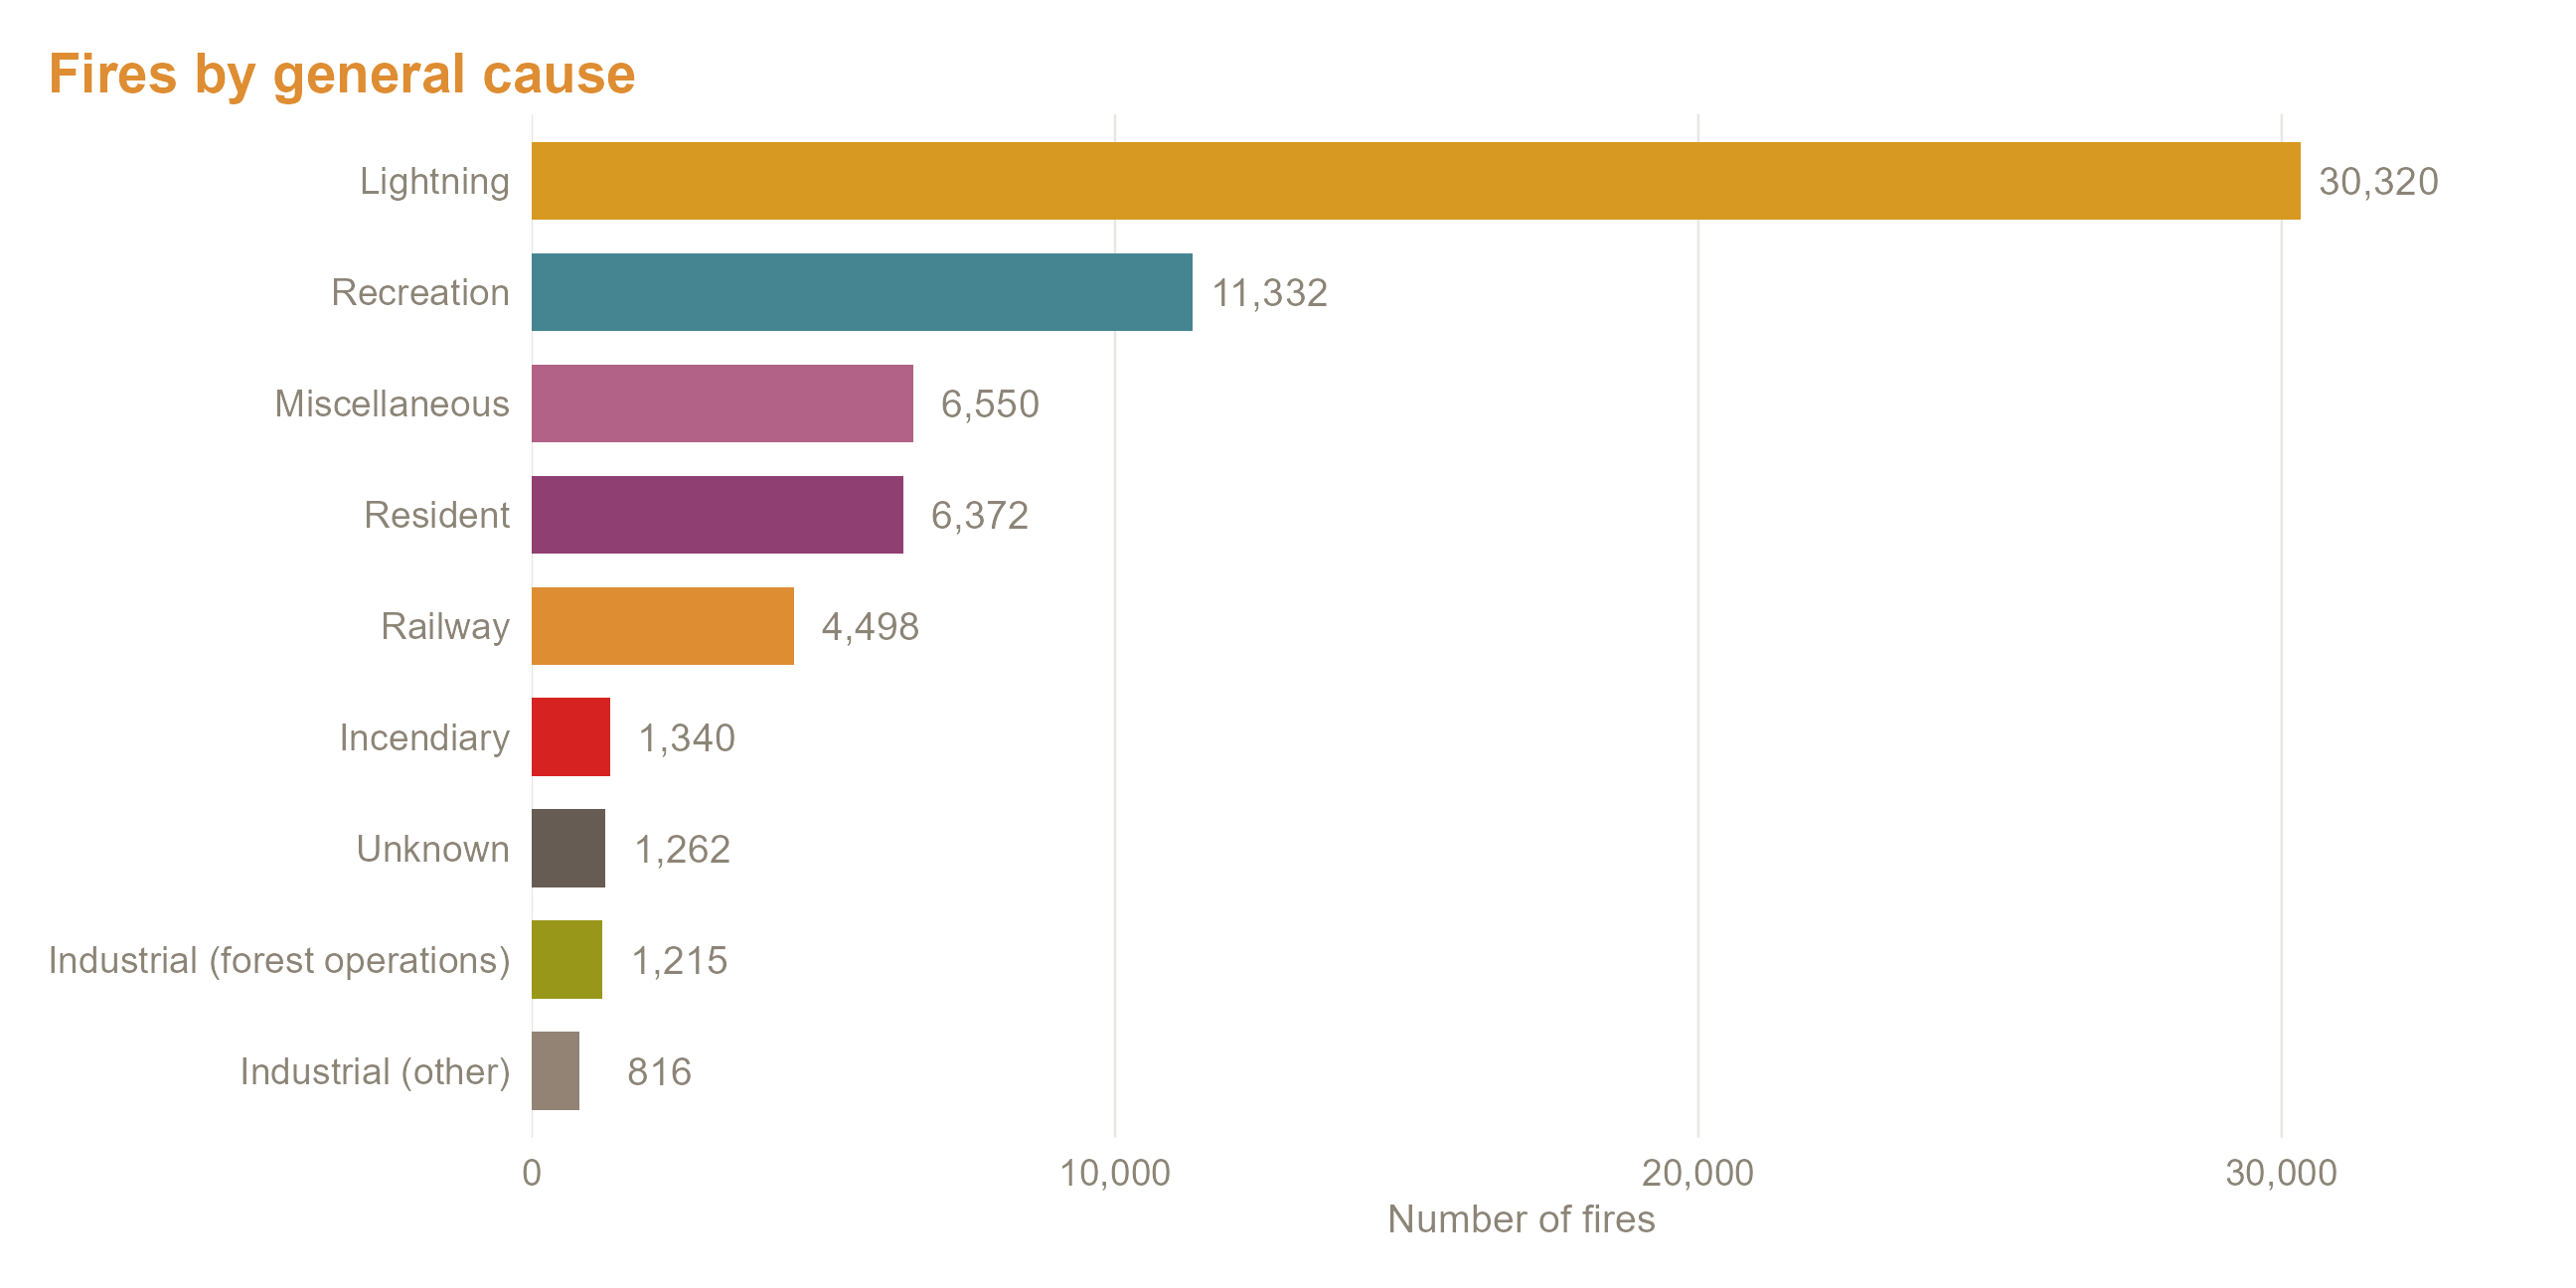
- Causes: lightning, recreation, residents, railways, industry and more, mapped and counted
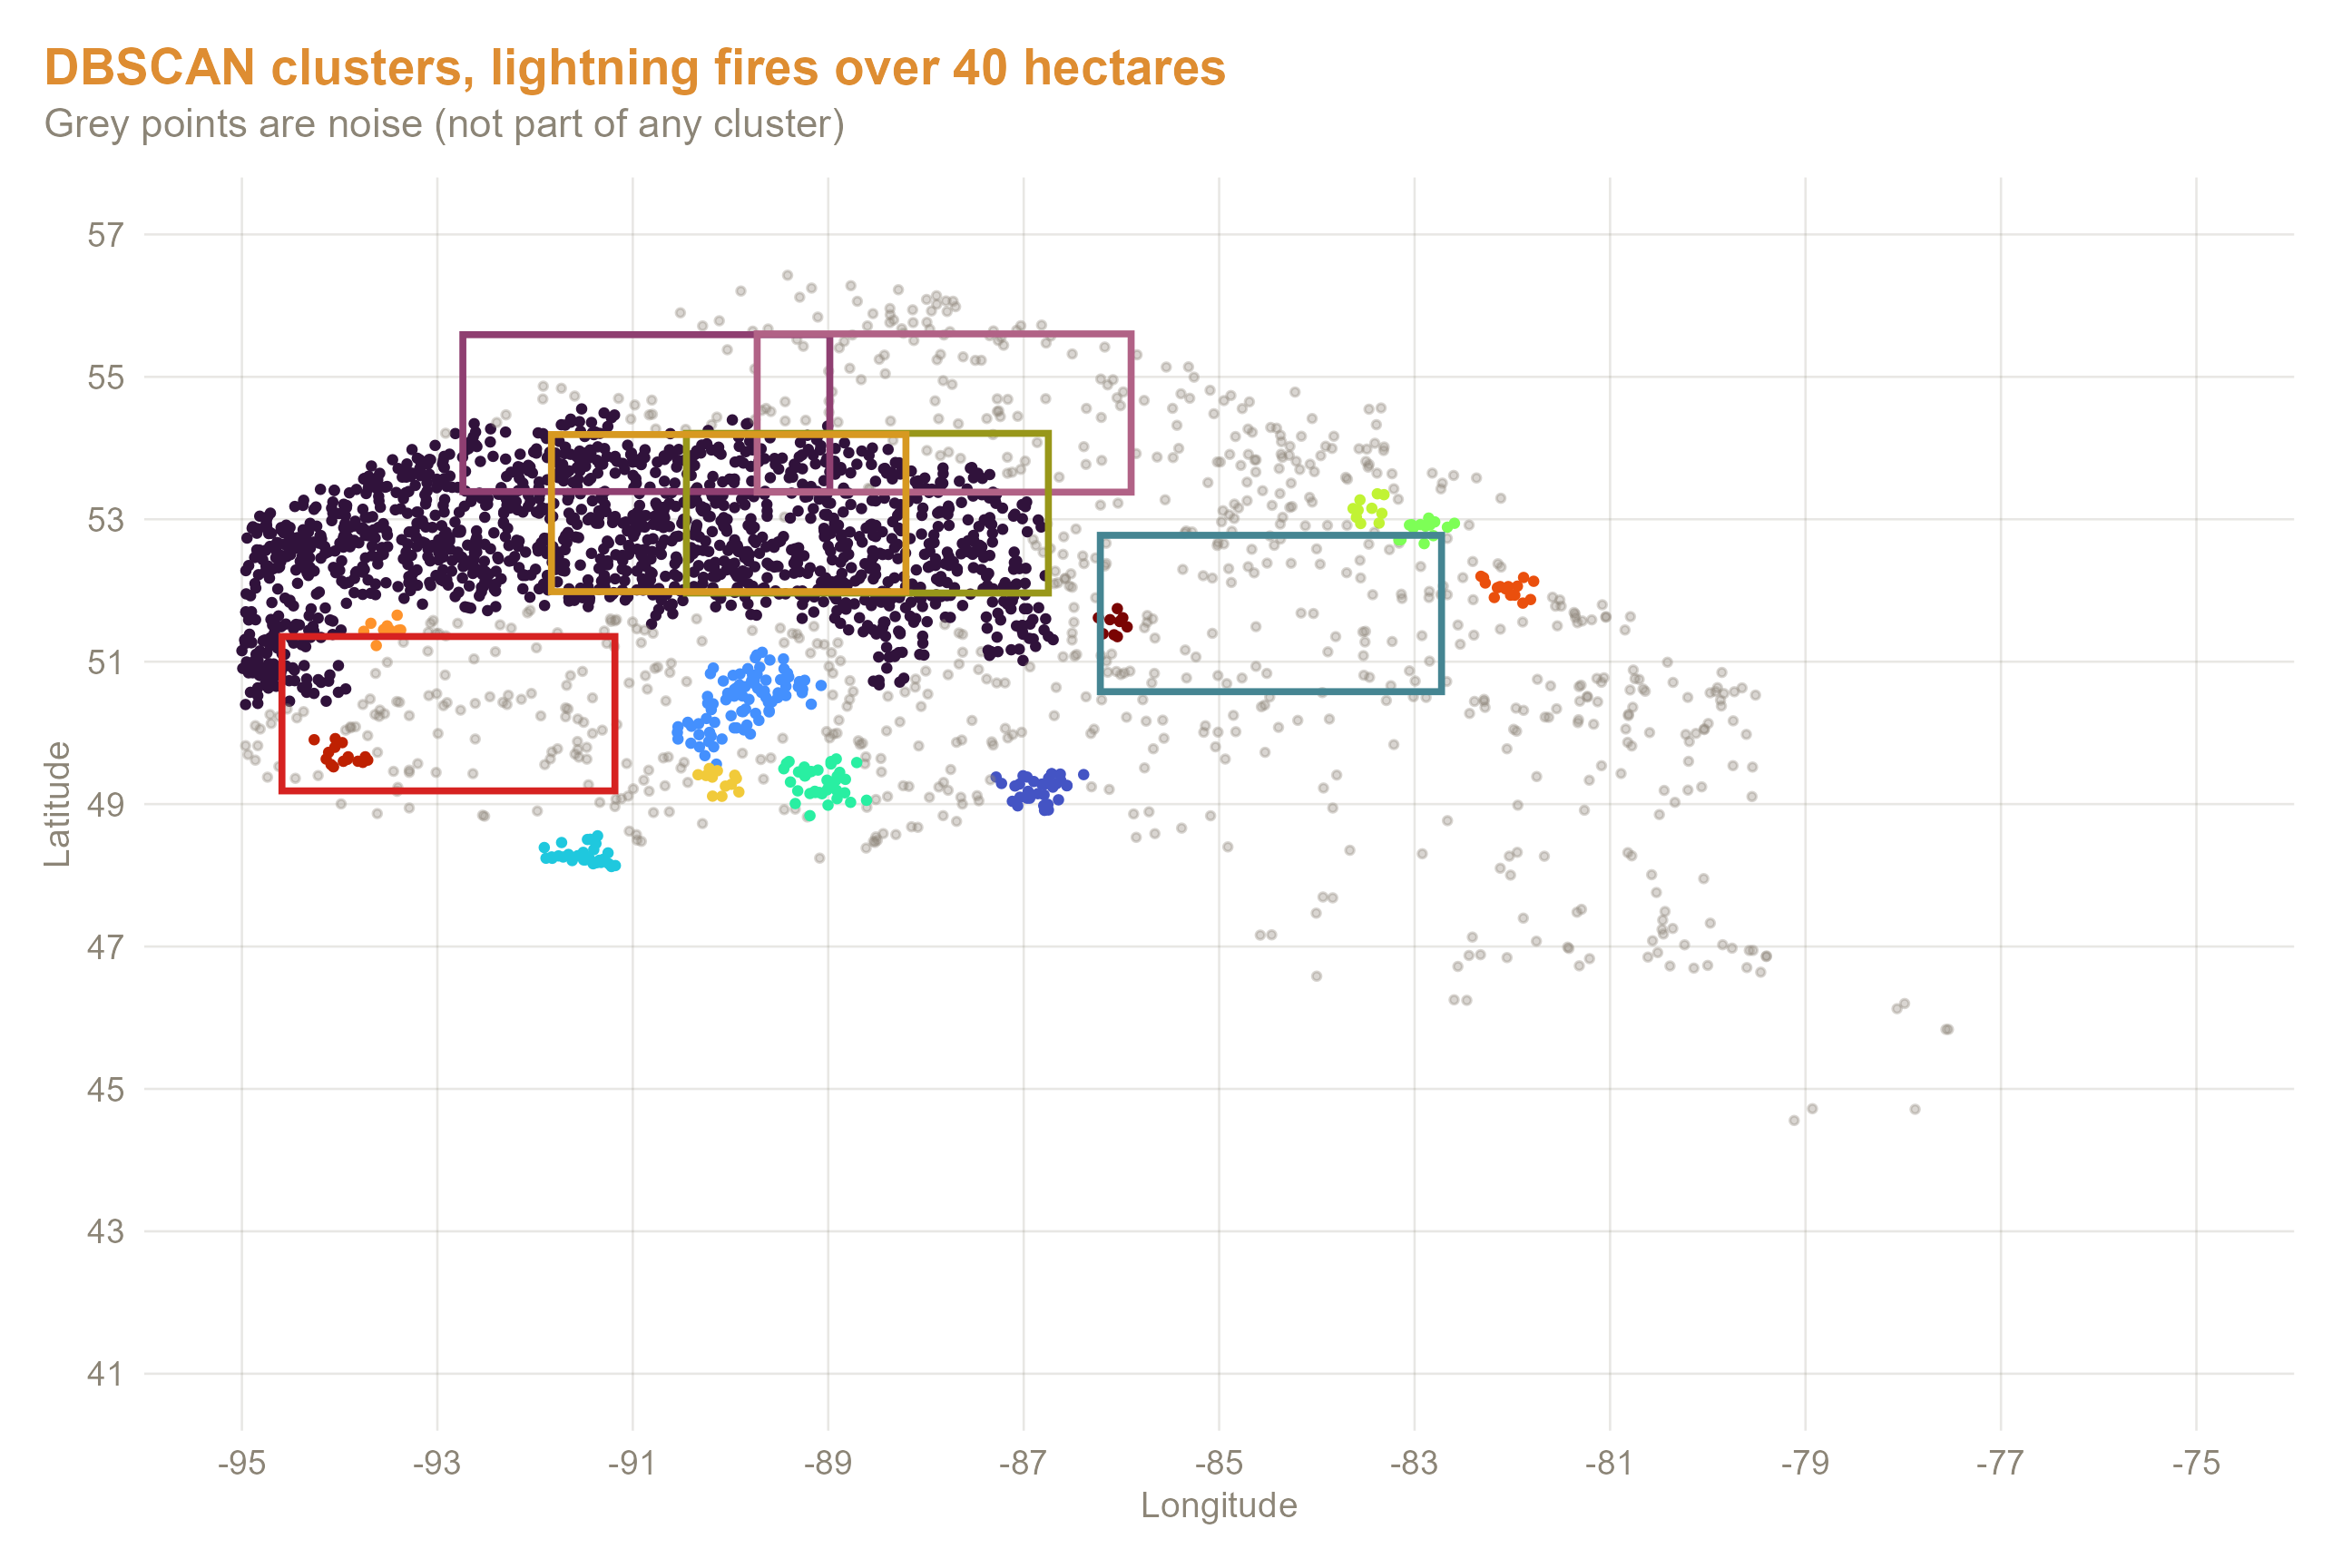
- Clustering: k-means and DBSCAN to find where large lightning-caused fires concentrate
- Interactive map of every fire over 40 hectares
Clustering large lightning fires
DBSCAN (eps = 0.25°, minimum 10 points) picks out dense groups of lightning-caused fires over 40 hectares. The boxes mark the main cluster regions.
Tools
R (sf, ggplot2, ggspatial, dplyr, dbscan, leaflet), with a basemap from Natural Earth.