
A walkthrough of the Analytic Hierarchy Process (AHP), a multi-criteria decision-making method, applied to geospatial flood susceptibility. Written during my final year at UofT for GGR494 (Special Topics in GIS), with every calculation done in R.
View the full report → · Code on GitHub
The idea
AHP is a way to make a decision when you have to weigh several options against each other, and some matter more than others. Choosing between two pies is easy. Add two more and you’re suddenly juggling every pairwise comparison: “I like A over B, but C beats A, and I’ll always take B over D…“. AHP turns those judgements into consistent numerical weights.
In flood analysis, those weights decide how much each terrain factor contributes to a location’s susceptibility to flooding.
The factors
| Factor | Why it matters |
|---|---|
| Topographic Wetness Index (TWI) | Where surface water accumulates |
| Elevation | Low ground floods first |
| Slope | Flat ground drains slowly |
| Floodplain proximity | Distance to the floodplain |
The weights
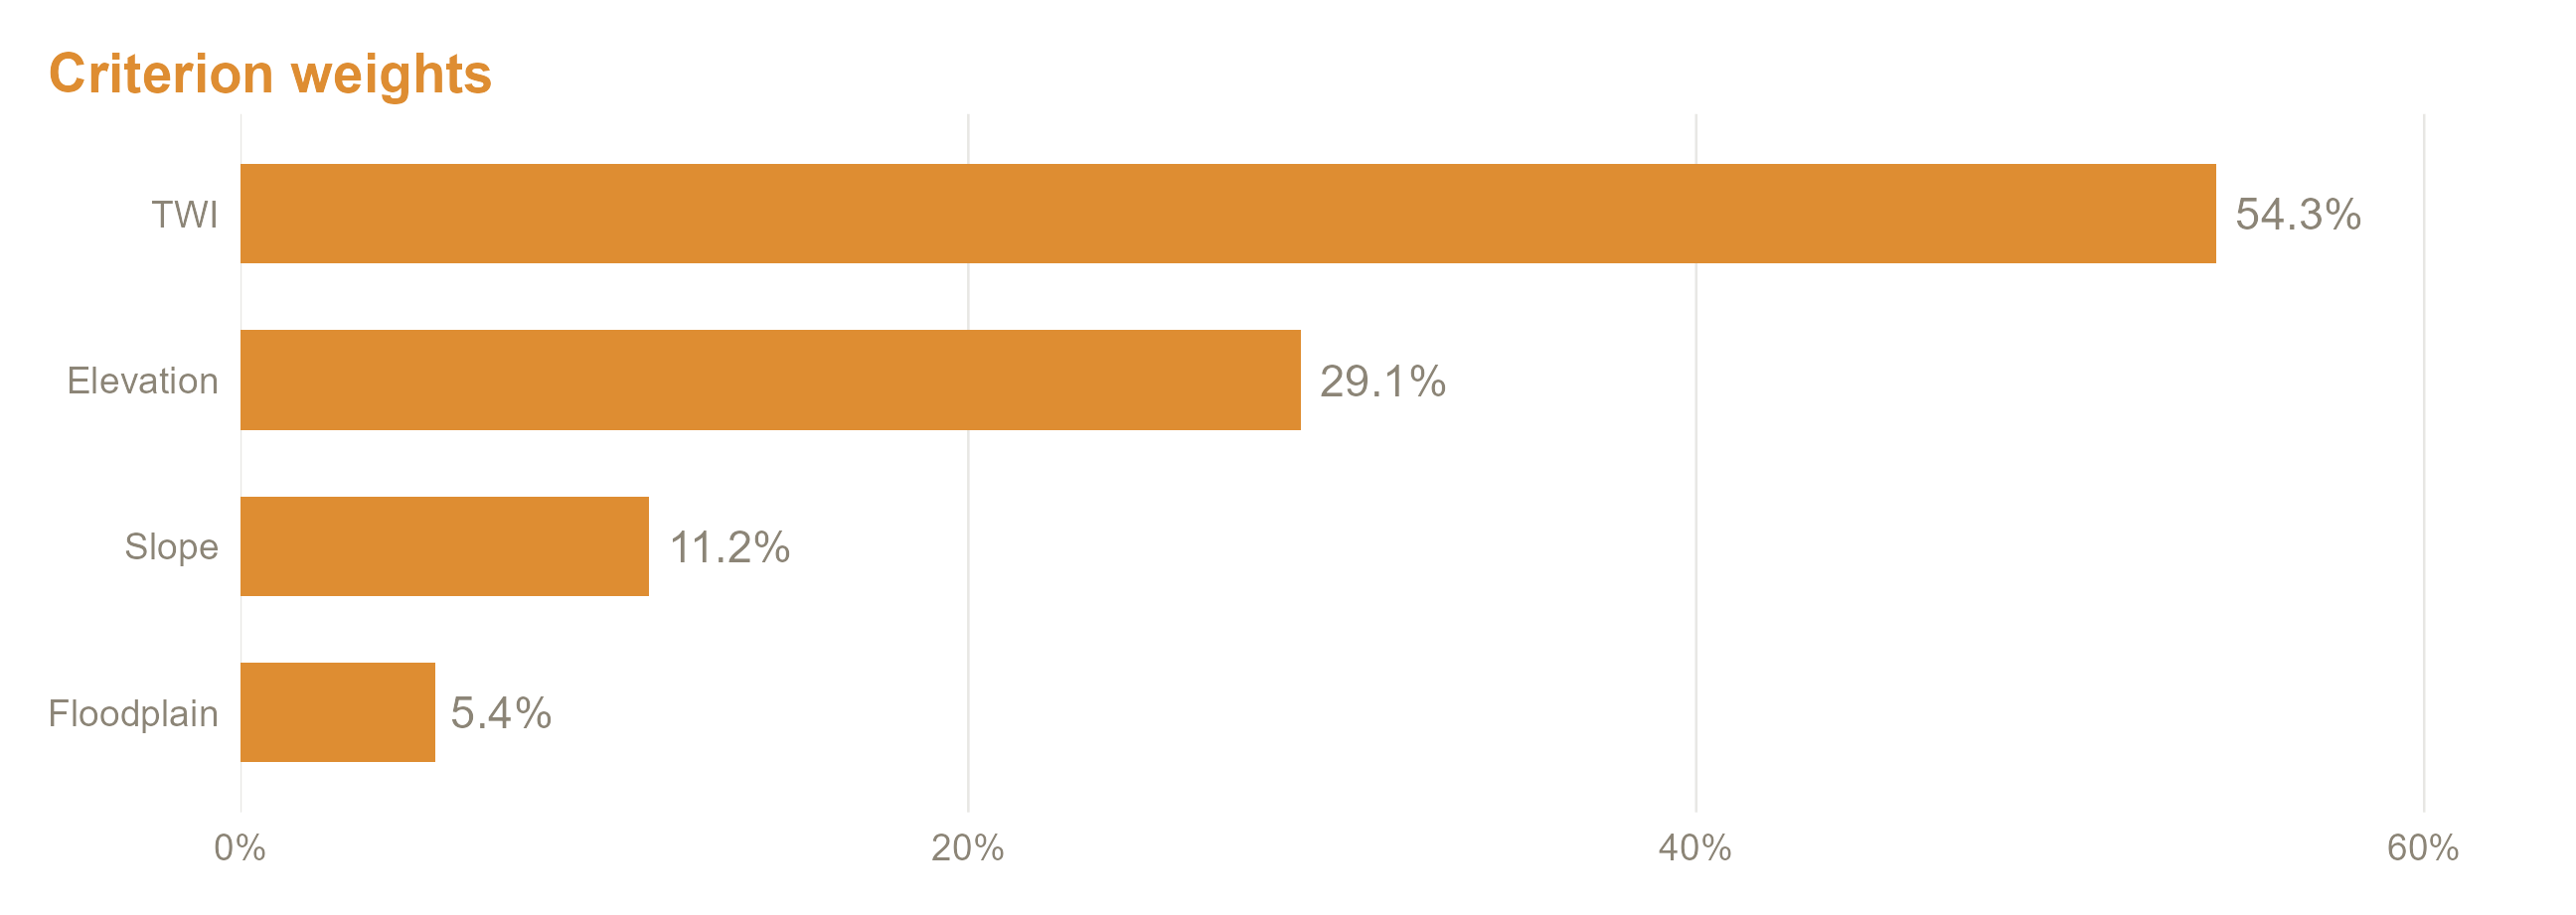
Each factor is compared against every other on Saaty’s 1–9 scale. The matrix is normalized, and each factor’s weight is the average of its row:
Is it consistent?
AHP checks whether the judgements contradict each other. The Consistency Ratio comes out at CR ≈ 0.064, well below the 0.10 threshold, so the weights are reliable enough to use in a weighted overlay.
| Measure | Value |
|---|---|
| λmax | 4.175 |
| Consistency Index (CI) | 0.058 |
| Random Index (RI, n = 4) | 0.90 |
| Consistency Ratio (CR) | 0.064 |
A limitation worth knowing
Elevation and slope are already part of the TWI calculation, so including them again is partly redundant. That choice came from limited free data. If you use AHP yourself, check whether your factors overlap like this.