
An undergraduate research paper that investigates urban sprawl of the Southern Ontario Greenbelt, utilizing GIS methods, spectral analysis, NDVI.
MIKAEL SYED†, ZACHARY WEBB‡, and JAMEEL MARDINI‡
†Department of Geography, University of Toronto, Mississauga, ON
December 2023
ERS304 Group Project.pdf
Abstract
This research paper employs Geographical Information Systems (GIS) tools and metrics to investigate the evolving landscape of the areas enclosed by Ontario’s Greenbelt. The study focuses on understanding the correlation and relationship between urbanization and population growth within the Greater Toronto Area by using metrics such as the Normalized Difference Vegetation Index (NDVI) and spectral data such as shortwave infrared data obtained from Landsats 8 & 9 and Landsat 5. By utilizing satellite imagery and GIS tools, we are able to measure variations in vegetation coverage over time, and by overlaying population data over the change of vegetation in the area, it is expected to see trends consisting of reduction of vegetation with increased population due to accelerating rates of urbanization. The findings are expected to shed light on future environmental issues and consequences such as the increased demand for additional infrastructure, damaging protected environmental reserves; this research paper is crucial for policy decisions and sustainable planning.
Introduction
Ontario’s Greenbelt is the world’s largest protected area consisting of two million acres of farmland, forests, wetlands, rivers, and lakes. The permanent protection of the Greenbelt is essential for climate-resilient communities and a thriving local economy. The Greenbelt was created in 2005 in response to environmental concerns and functions by restricting urban sprawl, preventing further loss of farmland and natural heritage. However, as the local population increases, demand for a greater amount of space to be taken by the city in the form of sprawl also increases and applies pressure on natural landscapes such as those presently protected by the Greenbelt and those without. It is expected that the land that is encased by the Ontario Greenbelt to the north and Lake Ontario to the south should be sufficient to support the growth of the city until 2031 (DeClerq, 2023). By employing GIS technologies, a clearer visualization of the effects of the Greenbelt on urbanization can be deduced to provide a deeper understanding of the state of Canada’s largest urban sprawl, and provides a baseline for more efficient and accurate policy-making decisions.
Methodology
The United States Geological Survey (USGS) Earth Explorer provides a large catalogue of image sets across spectral bands which may be used for a number of purposes. The sets used in this study range in time across years and months within those years as we searched for acceptable image sets broadly free of cloud cover or forest fire smoke. The satellite image datasets employed by this study originate from August 2005 (Landsat 5), July 2013 (Landsat 8), and August 2022 (Landsat 9). In contrast to most circumstances involving monitoring differences in the health of vegetation, optimizing for the peak growing season was not a primary concern in locating appropriate images as the difference between farmland, grassland, and forest against nearly any human construct is significant enough to appear in satellite images when classified appropriately as heavily distinct from the natural space that it replaced. In searching for imagery, searches were restricted to where cloud cover was between 0% and 10%, and it became fortunate that the area observed by the satellite, operationally classified as path 18 and row 30, was large enough that the images that claimed to have large percentages of cloud cover did not cover the study area. Different spectral bands were needed between Landsat 5 and Landsats 8 and 9, as different technologies provided a wider arrangement of bands for the later satellites. For the Landsat 5 images from 2005, band 3 (visible red) and band 4 (near-infrared) were used in calculation and classification, while band 4 (red) and band 5 (near-infrared) on Landsat 8 and 9 were used for all other snapshots. These images were all sourced within Level 2 of Landsat Collection 2 as it filtered out unprocessed imagery.
ArcGIS Pro served as the primary software for the analysis, providing the necessary tools to complete the primary objective of the study. With the spatial analyst tools provided under license from ESRI in ArcGIS, we were to utilize the Normalized Difference Vegetation Index as it is the metric used primarily to calculate vegetation health and the difference between images acts as a visual indicator of urban growth. To do this, the required bands were applied into the ArcGIS Raster Calculator with the following calculation for each satellite source:
Landsat 5 Thematic Mapper: (Band 4 - Band 3) / (Band 4 + Band 3)

Landsat 8-9 Operational Land Imager: (Band 5 - Band 4) / (Band 5 + Band 4)
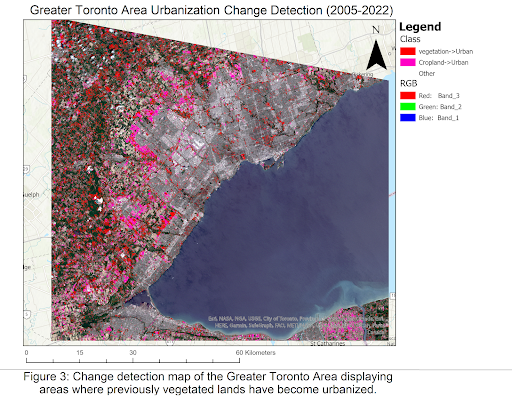
The resulting images were assigned a shared symbology that adequately displays the difference between areas recognized as natural and those recognized as urbanized. In the NDVI calculation, the maximum value of 1 represents the healthiest vegetation return signal, 0 represents minimal vegetation or bare soil, and -1 would represent water bodies at their clearest. Naturally, the perfect extremes did not appear in our images and we would not have expected them to. We then clipped to exclude regions outside of the region of study. For the primary overview maps that show the NDVI values for different years (Figures 1 and 2), the regions designated as Ontario Greenbelt were blacked out as it is not the activity within the Greenbelt itself that is of concern but instead the ceaseless march of urban development that threatens its borders. Limitations with the software itself, and the fact that the Landsat image is both XY-square and rotated at the same time, created excess regions of white which could not be clipped from underneath by merging with another existing raster dataset. This caused sections of the Greenbelt polygon to stick above sections where there was no data, and excess sections of the polygon had to be manually removed with Microsoft Paint. Utilizing both Landsat 5 and Landsat 9, a stacked raster file was produced using the composite band tool. Now with a TCC, stacked band file, a schema profile was created in the Training Samples Manager. The schema profile was created with four classes in mind, water, urban area, vegetation, and cropland. When the profile was completed, the classifier tool was used with the support vector machine classifier selected. The maximum number of points per class was also chosen to be analyzed to ensure the highest accuracy with the final result. This was done twice, once in 2005 and once in 2022. Change detection was performed with the Change Detection Wizard. As a result, vegetation and cropland were analyzed from the 2005 image to determine which areas were no longer natural land.
Results and Discussion
The data derived from Landsats 5, 8, and 9 provide valuable insight into the expansion of urban sprawl toward the border of the Greenbelt and our visual representation shows that the growth of urban space has been consistent over the study period, with the Mississauga/Brampton and Milton areas showing the greatest amount of growth over the course of the 17-year study period. Large masses of what used to be farmland have been converted into residential, commercial, and industrial property while the density of the city’s population has failed to increase by any substantial value in the same period (Shiab & Bouchard, 2022).
According to a 2022 study by Naël Shiab and Isabelle Bouchard, the rate of urban expansion from 2001 to 2021 in the Greater Toronto Area was 26.5%, which coupled with the region’s population growth of 27%. In the context of a city with a growing population which is bounded by a large un-developable region that bounds all sides, and a lake, the inability for the Toronto area to increase its density in new housing developments represents a significant problem in the region’s struggle in keeping the Greenbelt in one piece. While the implications of the Greenbelt itself are large, given how its intent is to prevent urban sprawl and is a reaction to it, it also provides a hurdle by which some cities are forced to work around in order to accommodate increases in population. Presently, the physical space enclosed by the Ontario Greenbelt between Scarborough and Hamilton is expected to remain sufficient to sustain the growth of the metropolitan area until 2031, and while various changes in provincial and federal policy can change the rate of growth, the inevitable growth of these areas remains a problem to be solved.
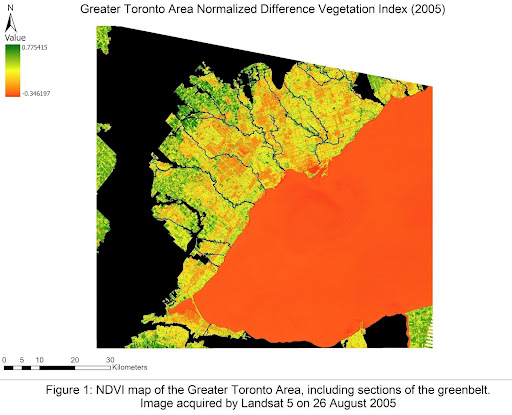
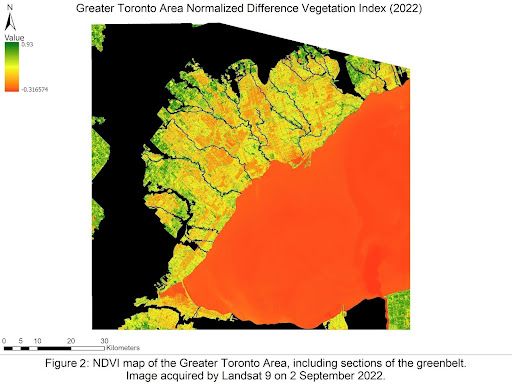
The figures 1 and 2 create a visual representation of the growth of the Greater Toronto Area and, in comparison between themselves, provide important visual clues into understanding the risk that the city’s continued expansion places upon the Ontario Greenbelt. Between the two years, 2005 and 2022, the amount of green space contained between the Greenbelt and Lake Ontario has diminished significantly. This corresponds well with the percent increase of urban land as described by Shiab and Bouchard.
The increase in lands used by the city since 2005, as demonstrated, represents the continuation of a trend that has been continuing since the establishment of the city. However, as much as the growth seems fast, the rate of growth in percentage terms declined in the previous decade against the last (StatsCan, 2023). With the amount of space remaining until the developed city reaches the Greenbelt, that reduction in pace must not be caused by a lack of places to build new residences. The physical growth of Milton, visibly increasing its size by a much more significant percentage than any other region on the map, represents a key connection to the situation at hand. Milton is not considered part of the Greater Toronto Area in metrics that define the latter’s population, but the town exists to the immediate south of the 401 freeway. It is likely then that Milton owes a significant amount of its growth as a municipality to its position as a commuter town, where people that need to work in the downtown core will seek out its land as they search for more affordable living conditions while also having a direct connection to where their work is. Evidence to this can be found in the comparative lack of growth of the town of Georgetown, to the northeast of Milton and west of Brampton, where the physical growth of the town, though bounded on the east by Greenbelt lands, has been glacial by comparison to Milton, something that may be attributable to a lack of a direct arterial road to the core.
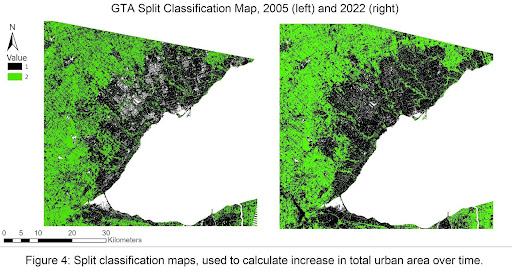
Figure 4 displays the same information as the NDVI calculations of figures 1 and 2, but collapses the range of data into one of three categories by splitting them with natural breaks. The first, and which was the subject of many struggles by the team, is the white mass that represents Lake Ontario and some internal area to be discussed. The second is the developed area in black and the third is the undeveloped area in green. However, the information critical here is the amount of space that is assigned as urban black pixels. By comparing the two against each other, meaning the direct mathematical division of their urban pixel count, it can be determined the total area assigned as urban increased by 13.58% in this wide view from 2,412,686 assigned pixels to 2,740,347 assigned pixels. By including a significant amount of green space in the map outside of official Greater Toronto Area boundaries, the outcome of the calculation is going to be lower than the Shiab and Bouchard calculation by default. However, error is also sourced in the 2005 in areas that are visibly white despite being in urban limits, and also through additional black space permeating the area beyond city limits. It is impossible to say if the effect of these stray values cancel out their influences in quantity or not. There were some notable limitations that the team faced going into the development of this paper. The first came in the form of permissible satellite data in our collection efforts. There were few occasions where Landsats 5, 8, and 9 passed over the Greater Toronto Area without a measure of cloud cover during the times of greatest growth. Naturally, cloud cover is to be avoided in any instance of satellite image use but especially when the exact values of individual pixels can come to matter. This resulted in the necessary change of two date ranges from the initial dataset from an August 2023 dataset to an early September 2022 set, and a June 2006 dataset to an August 2005 dataset. While this may initially appear to be the product of problems arising, the end result is actually a more unified dataset across years which improves the presentation of the collected information. The limitation of data was especially apparent during the production of the NDVI maps. The team originally included a June 2018 dataset-derived map, and while it did prove the growth of the city was continuing as the string of maps did, the early period into the growing season that was represented provided a poor presentation using NDVI on the difference between urban sprawl and green space
Conclusion
By visual inspection alone, it is clear that the rate of urbanization in the Toronto area has not been an area of significant concern for policymakers in the previous decades, as density change in the city as a whole has remained within a rounding error of zero since 2001. With each passing year, the outer edge of the region’s developments are finding their way closer and closer toward the edge of Ontario’s Greenbelt, eating up more and more farmland and (some) forested spaces along the way. The preservation of those lands, both those that have yet to be developed outside of the Greenbelt and all of the space within, has to be seriously considered by those responsible for planning around the loss of habitat and biodiversity that comes with urban sprawl. While the growth of a city is inevitable in almost all cases, the way that it is developed is not. A sustainable approach is going to be required in order to ensure the survivability of both the city of Toronto and its surrounds, as well as the greenspaces that are home to many declining wild species. The approach of using NDVI to produce a visual representation of that change is simple and clear, and the message is that positive change is yet to be seen.
We believe that the rate of growth, while fast, could be slowed by enabling a greater amount of varied residential arrangements outside of what is called type “R1” in Canadian urban planning, that is, single family homes. The rate of growth may be slowed by a greater development in denser housing arrangements that cities nationwide are simply failing to incorporate into their strategies. However, it remains at the hands of current urban planners to decide if the Greenbelt is worth preserving or if urban sprawl is worth having.
References
DATA ONTARIO., 2019, Greenbelt Plan mapping. Available online at: https://data.ontario.ca/dataset/greenbelt-plan-mapping/resource/19e53abf-6642-4e59-af20-e279b2ffa250 (accessed 04 December 2023)
DECLERQ, K., 2023, Ontario has enough land for 2 million homes without the Greenbelt, report finds. Available online at: https://www.cp24.com/news/ontario-has-enough-land-for-2-million-homes-without-the-greenbelt-report-finds-1.6294776?cache=878 (accessed 03 December 2023)
GOVERNMENT OF ONTARIO. 2023. Ontario Population Projections. Available online at https://www.ontario.ca/page/ontariopopulationprojections#:~:text=Under%20all%20three%20scenarios%2C%20Ontario’s,million%20on%20July%201%2C%202046 (accessed 04 December 2023)
GREENBELT FOUNDATION, undated, Ontario’s Greenbelt. Available online at https://www.greenbelt.ca/learn (accessed 03 December 2023)
SHAIB, N., BOUCHARD, I., 2022, We used AI to measure Canada’s urban sprawl. Available Online at:
https://ici.radio-canada.ca/info/2022/03/etalement-urbain-densite-population-villes-transport-commun-changements-climatiques/en (accessed 04 December 2023)
STATISTICS CANADA, 2023, Census Profile. 2021 Census of Population. Available online at: https://www12.statcan.gc.ca/census-recensement/2021/dp-pd/prof/details/page.cfm (accessed 04 December 2023)
STATISTICS CANADA, 2022, Population and dwelling counts: Canada and population centers. Available online at: https://www150.statcan.gc.ca/t1/tbl1/en/tv.action?pid=9810001101 (accessed 04 December 2023)
UNITED STATES GEOLOGICAL SURVEY, undated, Landsat 8. Available online at: https://www.usgs.gov/landsat-missions/landsat-8 (accessed 03 December 2023)